By: Sourabh Lal, Sonia Alouni, Charlotte Theisen
Introduction
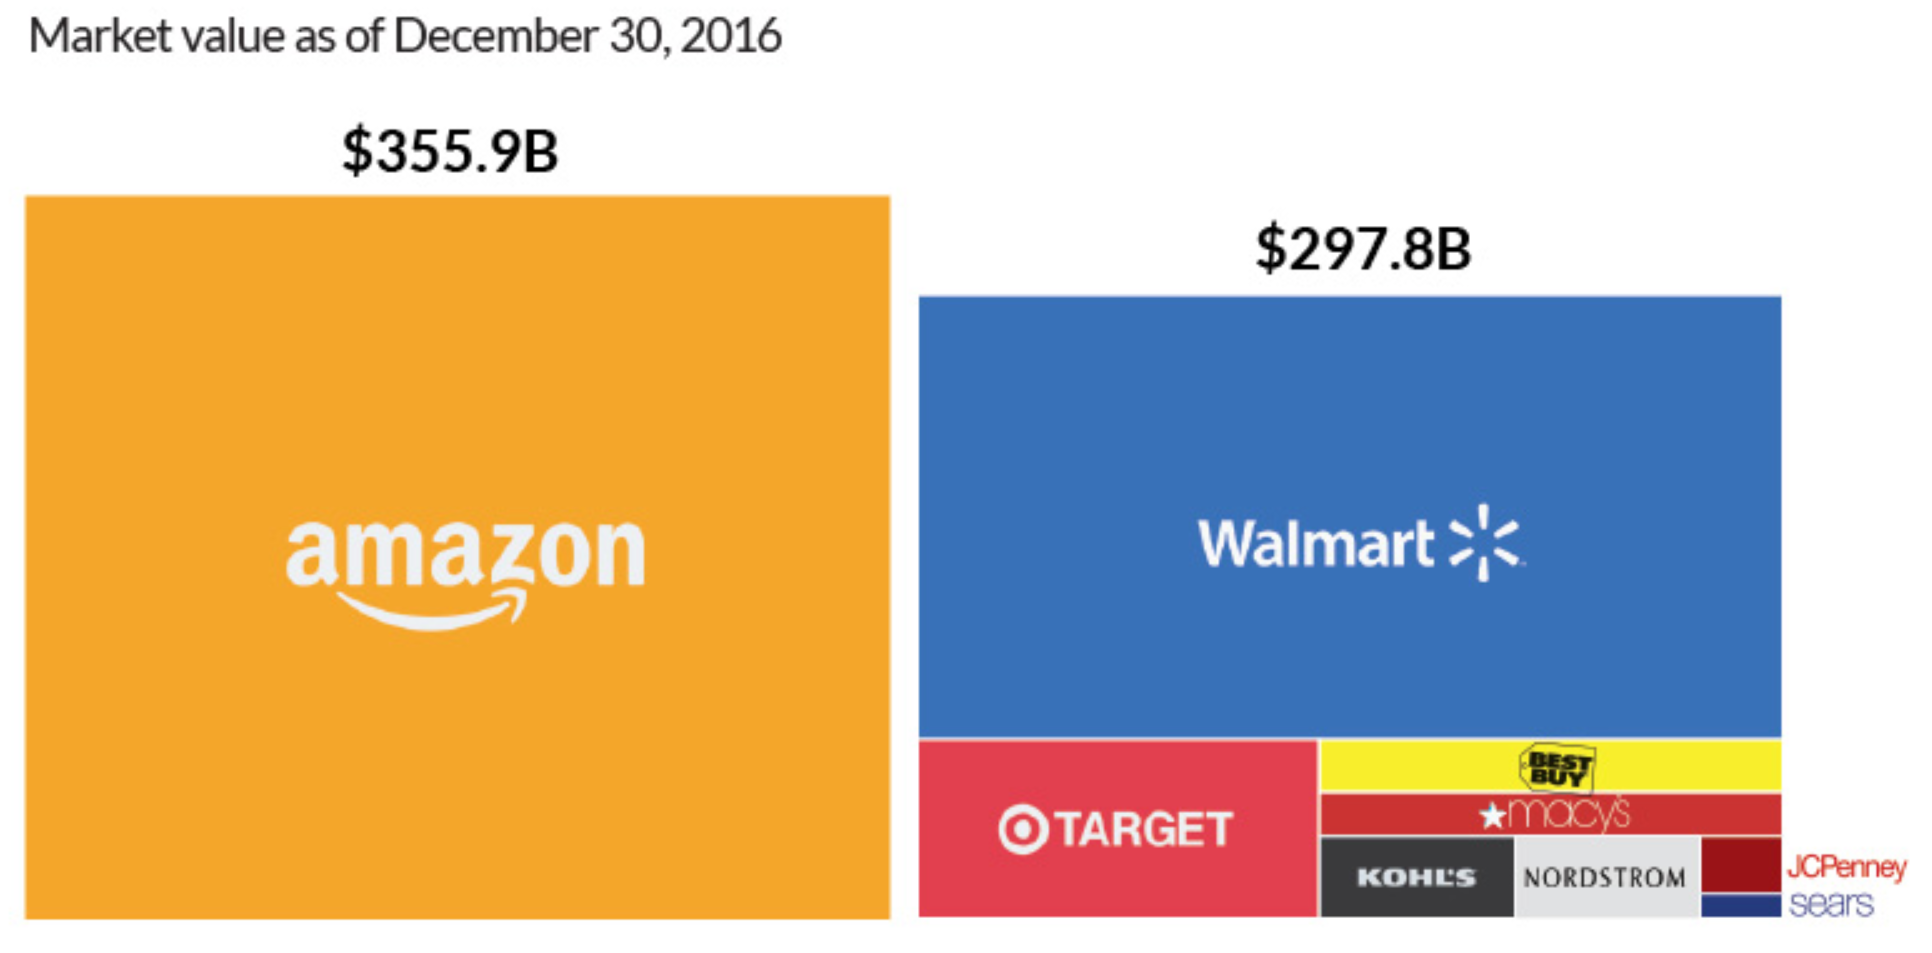
Amazon.com has been making waves for the past decade or so, as they grow stronger and stronger. What once started as a small online bookstore, has now become not just America’s largest retailer; but a company bigger than most brick and mortar retailers in America put together.
We are now right in the middle of America’s great retail period; the holiday season from Thanksgiving till Christmas! Amazon has said the 2016 holidays were its best-ever shopping season. During the winter holiday season, not only did they sell 50% more items than the previous year, but they also doubled their total sales for 2016 (Source).
One of the consequences of this amazing growth has been an explosion of data. Every product sold on amazon has metadata than can be analyzed and insights can be gained. Furthermore, Amazon has excelled in collecting consumer reviews of products sold on their website and we have decided to delve into the data to see what trends and patterns we could find!
The data we examine in this project comes from the McAuley Amazon Review Dataset. This dataset contains reviews of products sold on Amazon spanning a time period from May 1996 to July 2014, as well metadata about each of these products.
Naturally, many people, whether happy or disappointed, will want to share their opinion of their new product with the world. Even within the single product category Electronics, more than 1.5 million reviews have been written by the consumers. This is the category we will examine further here, but it should be noted that we have looked at other categories and observed similar trends and patterns.
Amazin’ growth
The amount of reviews written on Amazon is of course a different thing than the amount of sales. However, we did suspect that the growth of Amazon’s sales must have an effect on the amount of reviews - if more products are sold, surely more products must be getting reviews. Therefore, we visualized the number of reviews per day over the entire time period available in the dataset along with a moving average.
The number of reviews is a good indicator of how people’s use of Amazon reviews has evolved through the years. As suspected we do indeed see a very clear trend that seems to accelerate every year. In the first decade of Amazon’s existence almost no reviews were written even though the option was there. The increase starts around 2005 and continues slowly until 2012. In 2013 there is a sudden increase in the amounts.
The increase in reviews could of course also be due to some internal changes in how the reviews are promoted or whether Amazon encourages people to write a review or not. The general growth of online reviews as a discipline might also have made consumers more familiar with it and interested in writing their own review. A third explanation could be that Amazon have removed old data or some data is missing, however, we have no way to verify that this is the case.
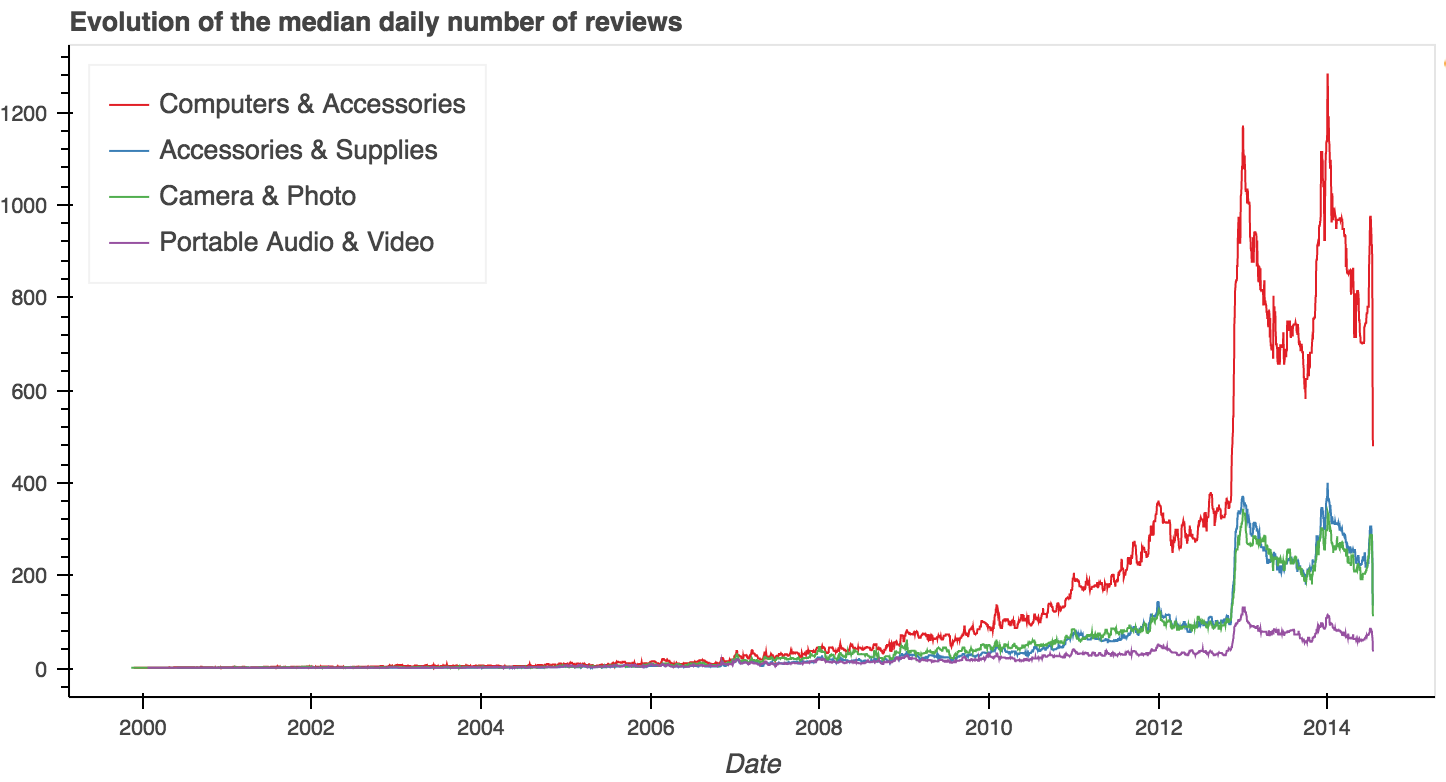
To understand whether this is a global trend or perhaps one or more subcategories of Electronics that leads the the trend, we have looked at the amounts of reviews per subcategory. We notice that they all follow the same trend, although at different scales depending on the number of products they contain.
Discovering seasons
We have already mentioned how the increase in sales during the christmas season of 2016 was quite tremendous and therefore an interesting question to ask is whether this also means an increase in reviews and whether this trend is a regular occurence?
To answer this question we look at the time series decomposition of the data.This decomposes the data into a trend component, a seasonal component and a residual. The latter is the variation in the number of reviews that cannot be modeled by the former two components.
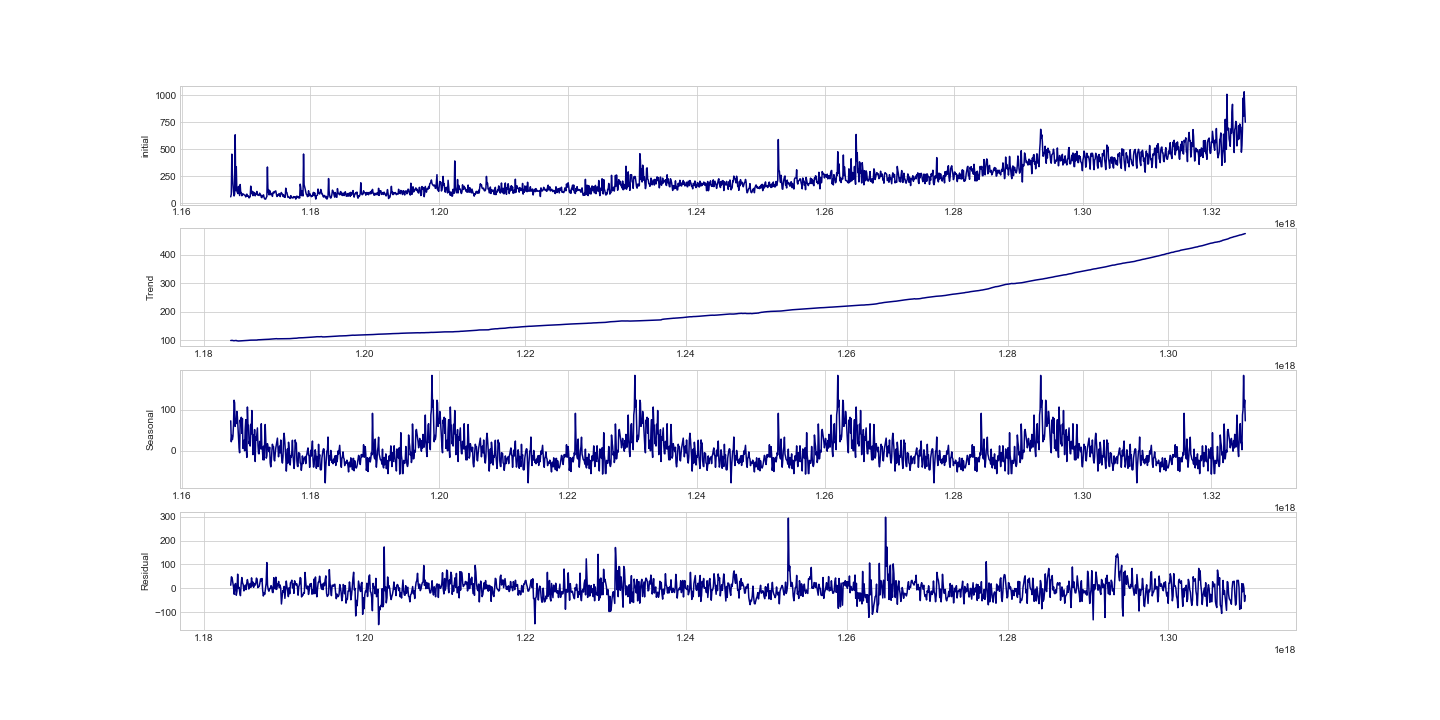
The decomposition is only done on the time period from 2007 to 2011, since the jump in the number of reviews after that is too large to be captured by the model and the years before that have to little data to yield interesting results. Looking at the seasonal component, we see a clear spike right around every new year fitting surprisingly well with the Christmas season. Even though 2012 and 2013 are not taken into account in this plot it should still be noted that we can observe the same phenomena for this year.
Below we can see how the monthly mean of the number of reviews varies. While 2013 and 2014 have a lot higher means than the other years, the trend does persist, and we can see clear spikes in January and December. While it isn’t to the extent that sales did, we conjecture that this could be attributed to the fact people can’t write reviews for gifts they gave or received.
We tried to investigate whether there is another form of seasonality left in the residual component, a weekly one for example. Do people write more reviews on the weekend perhaps? Starting from the hypothesis that there is a 7-day period in the series, we estimated weekly trends.
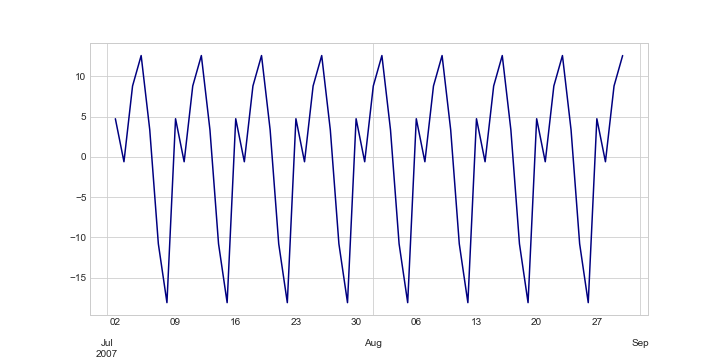
Here it seems like the customers prefer to review their new products during the weekdays. Clearly less reviews are written on Saturday and Sunday, and Thursday seems to be the preferred day of the week for writing reviews.
Have the reviewers become lazy?
An interesting pattern that we notice in the data is the evolution of the length of the reviews. It seems that the average daily length of the reviews tends to be longer during the years 2008-2012 compared to the years 2013-2014. Before 2008 there were so few reviews that the variance is huge and we cannot say a lot about that period.
We observe a drastic drop in the length of reviews that occurs at the end of 2012. This is not as easy to explain. We tried to examine whether this could be due to some kind of restriction from Amazon, but that does not seem to be the case, as we still have the very long reviews in after 2012.
Amazon Claus brings joy to all?
In order to know whether the Christmas season or perhaps the sunshine of the summer would change the sentiment of the reviews, we looked for trends in this type of data using both IBM Watson and NLTK Vader to compute the sentiment. Although NLTK Vader is trained on social media data, and tests have revealed that it isn’t the best estimator of sentiment in Amazon Reviews (precision = 0.78 and recall = 0.55 ), we decided to use it as it was the best available means for this project. We used IBM Watson for some analysis too but it was impractical given the high amount of data we had to process.
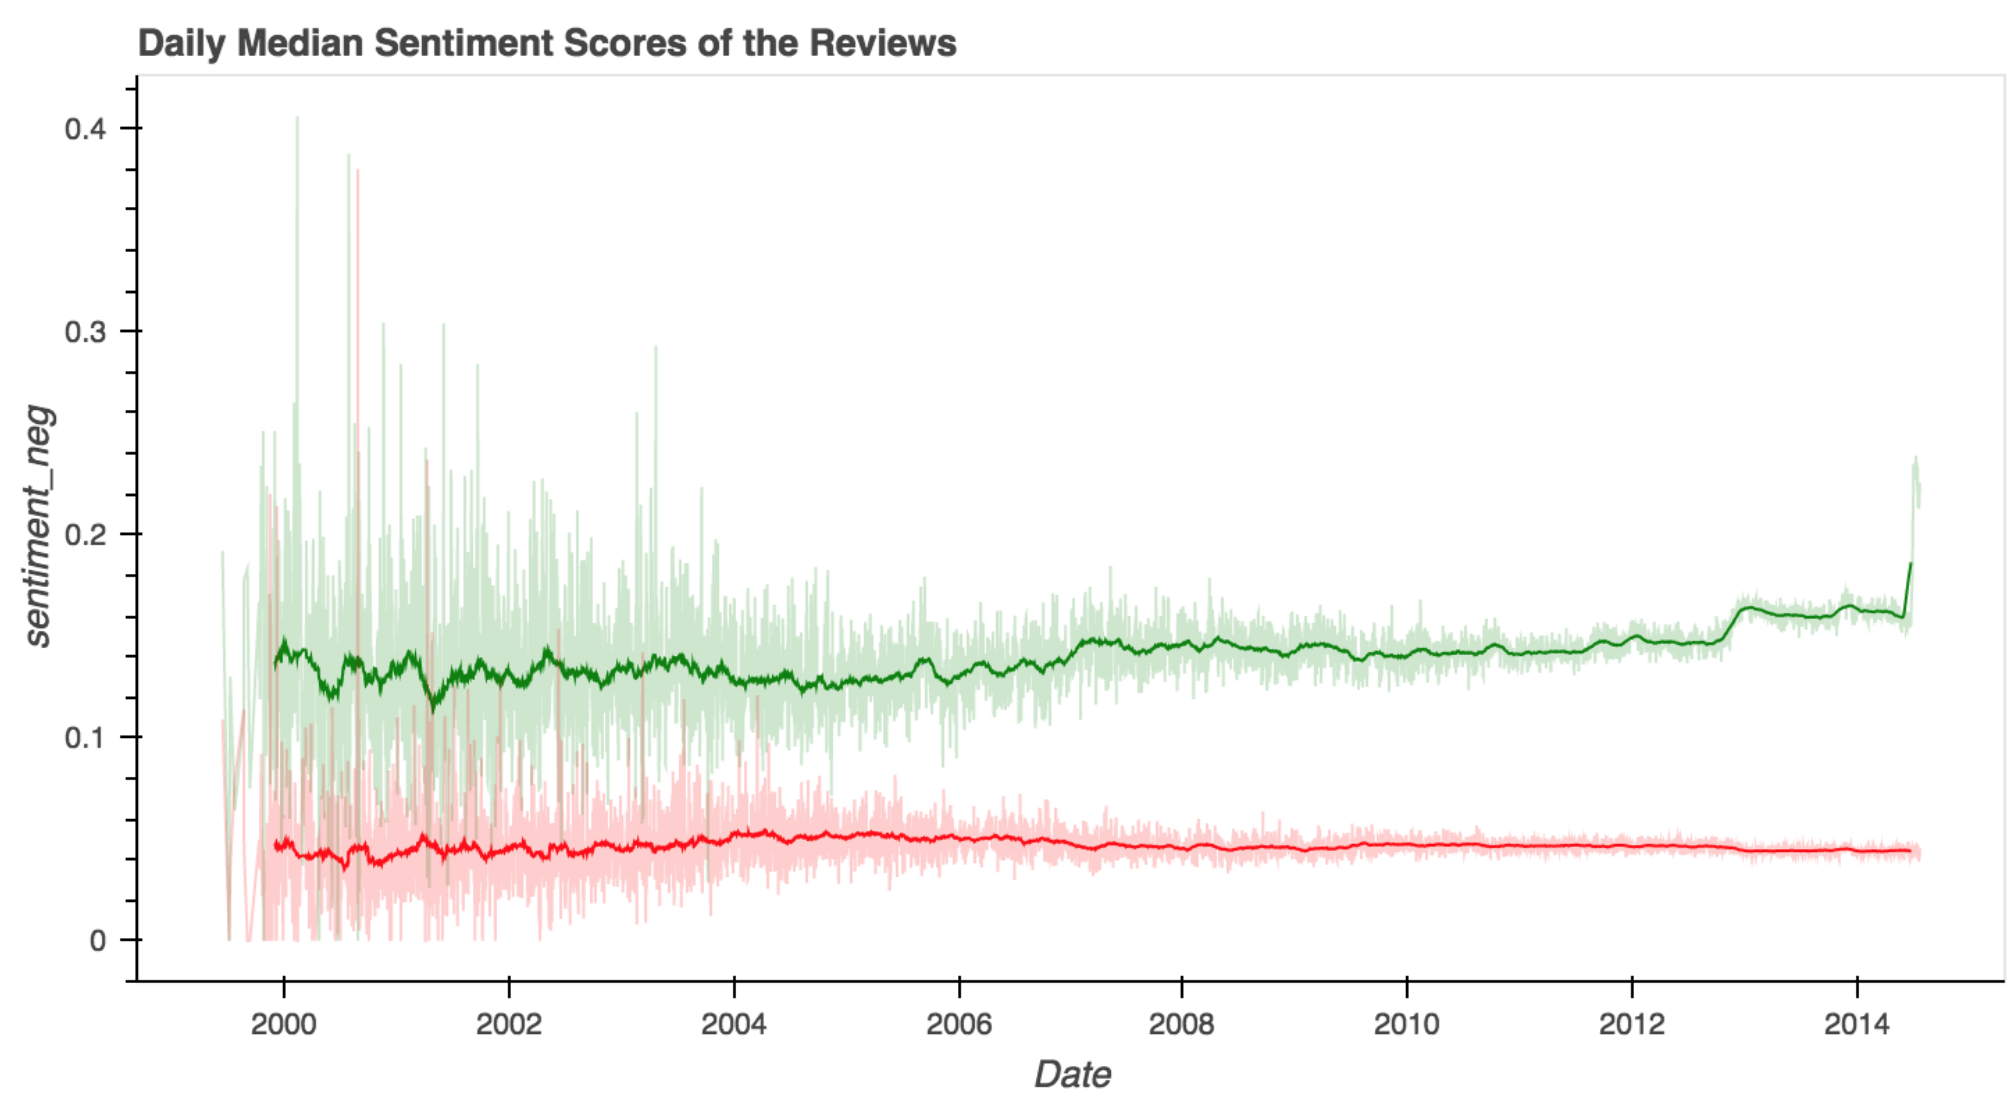
In the NLTK Vader sentiment scores we see that the negative sentiment seem to remain steady throughout the whole period, except for the first years were, as always, the variance is very high. For the positive sentiment we observe an increase at the end of 2012 and we see that the positive sentiment is in general higher than the negative.
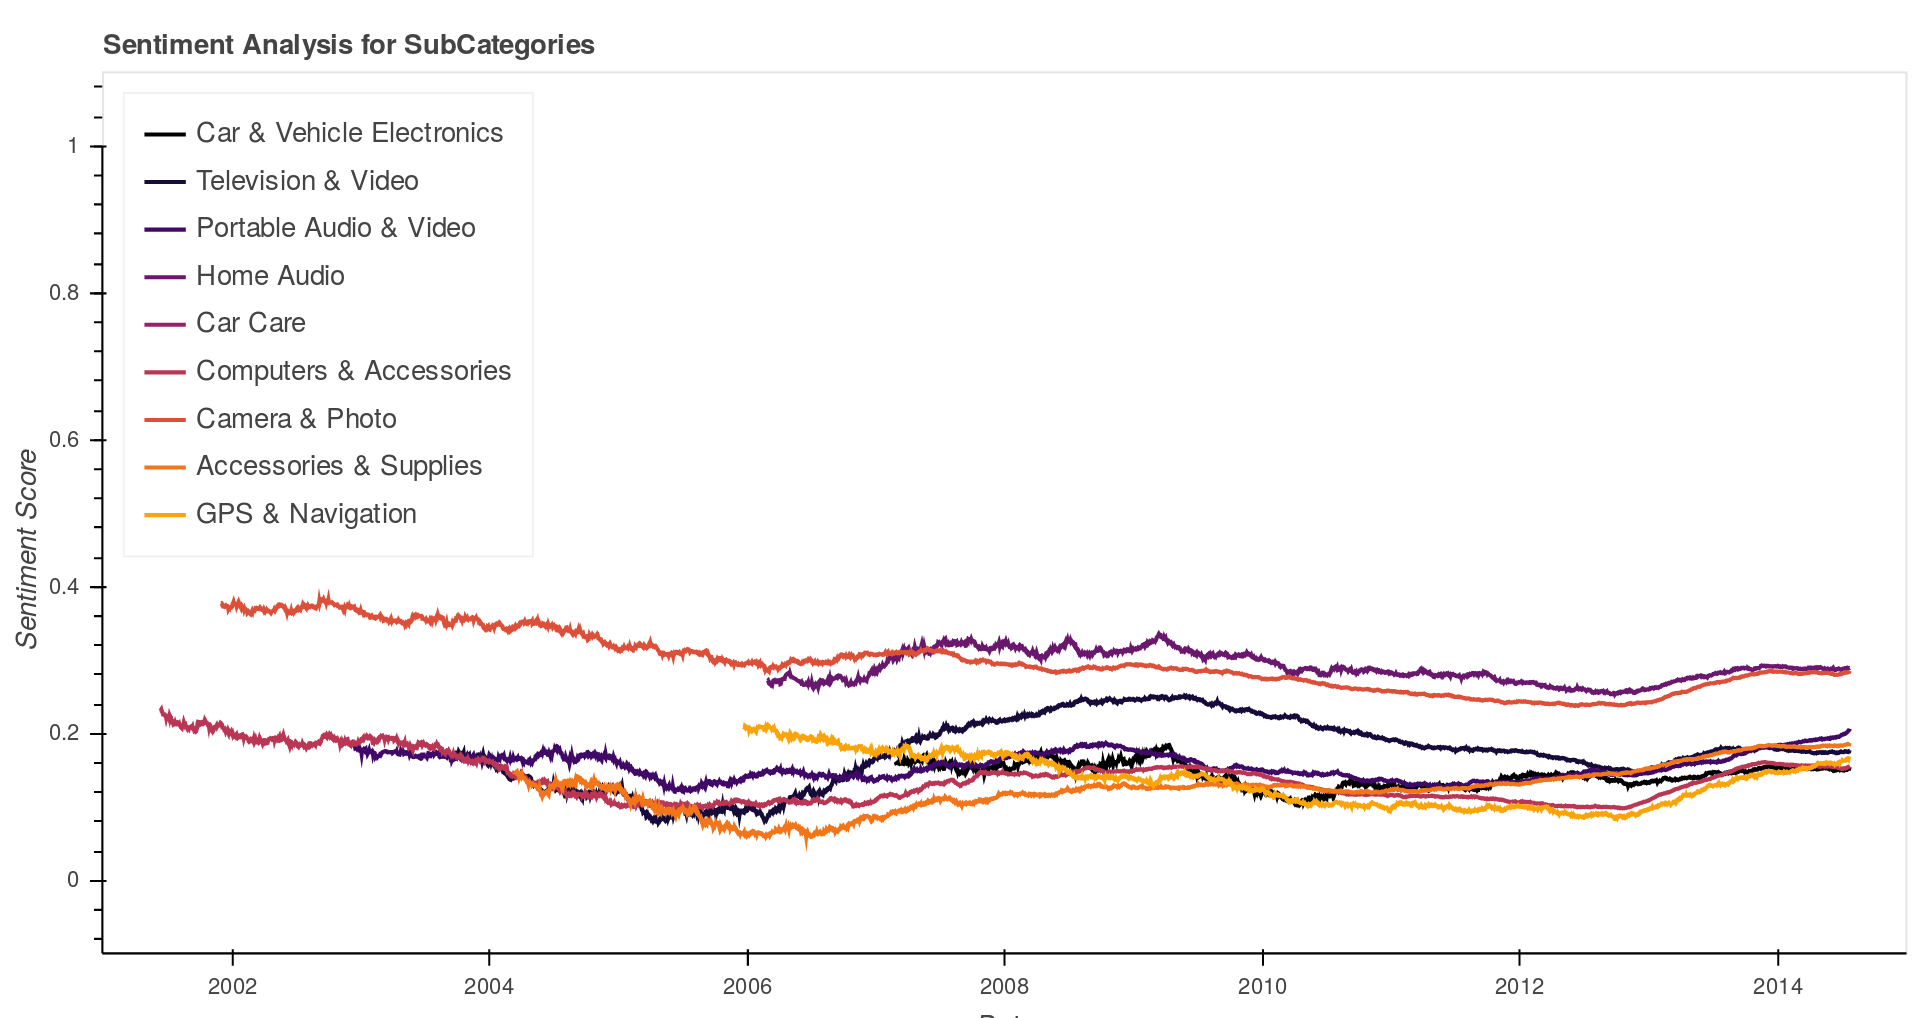
Further using IBM Watson we computed an averaged sentiment score by sub-category. What this revealed was that most categories average sentiment stayed fairly consistent across the 12 years when we had sufficient data to compute them. However, we can notice that some categories consistently were associated with a higher sentiment than others - for example, Camera & Photo was consistently higher than GPS and Navigation.
We wanted to compare this to the ratings of products, called their overall score. Below we have plotted the daily average overall score. Interestingly we observe the same kind of jump at the end of 2012. Here the overall score have a sudden increase which fits intuitively well with the jump in positive sentiment.
Is it all related to the holiday season?
We thus have three attributes of the reviews; positive sentiment, overall score and length, that undergoes a sudden change at the end of 2012. They all seem to stay at a new level. These increases happen at the same time as we have an extreme increase in the amount of reviews. Remarkably all these trends are observable again at the very end of 2013, but all on a smaller scale. This all leads us to suspect a relation between all these variables and then again a relation to the christmas holiday season.
A suspicion is often the beginning of interesting discoveries and therefore we followed this path further to try to get a more substantial indicator of the relations between all these factors. From looking at correlations we found that they are all slightly related as we expected but unfortunately the correlations are not significant enough for us to draw solid conclusion. This might be due to very high variance within all the variables. Consequently, further analysis would have to be carried out to really be able to either confirm or deny our suspicion.